

It’s no secret that learning took a major hit after schools shut down during COVID-19 (and that many stayed closed, at least partially, well after the pandemic reached its peak). In fact, it’s arguably the most well-documented trend in modern education. But the implications are more nuanced, more complex, than a simple across-the-board achievement declines.
As it turns out, the closures also affected the achievement gap between low and high performing students in peculiar ways, sometimes narrowing the divide between them.
These changes are visible thanks to a new tool from The 74, showing a multi-decade timeline of student performance by state. Specifically, it looks at changes to eighth-grade math scores on the Nation’s Report Card, or NAEP.
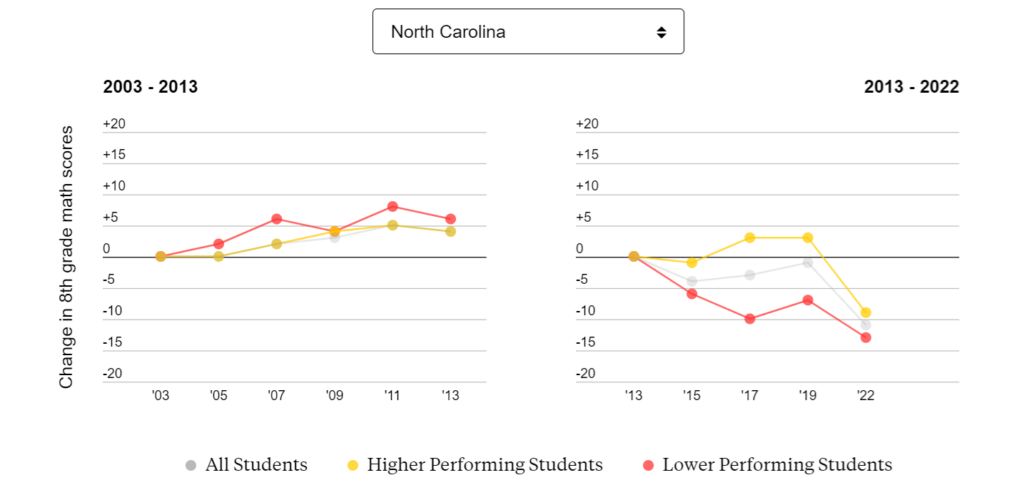
In North Carolina, math scores steadily improved for all students between 2017 and 2019. However, those scores took a steep dive between 2019 and 2022. The achievement gap between students also narrowed during the COVID-era, mainly because higher-performing students experienced such a sharp decline in scores.
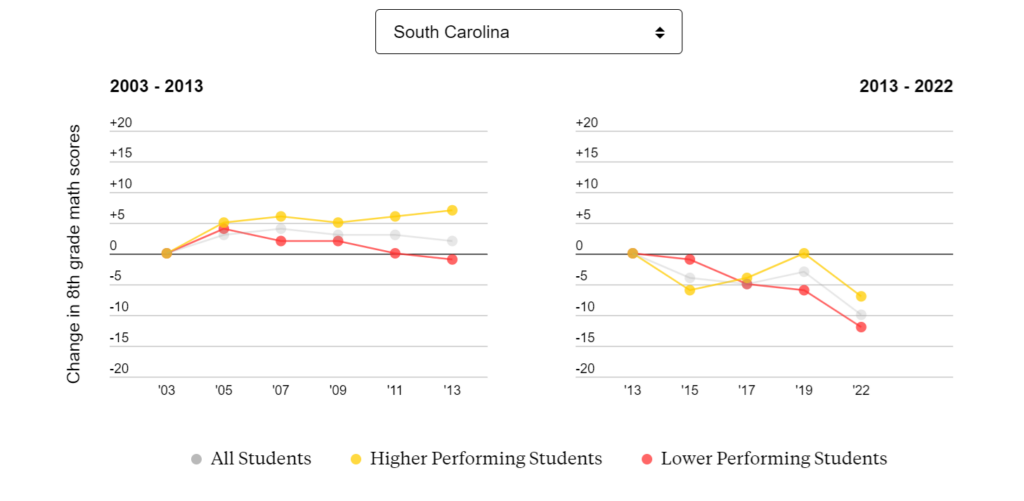
What immediately stands out in South Carolina is the troubling decline in math scores for lower-performing students, happening long before COVID-19. This fact alone deserves the attention of education leaders. Meanwhile, the gains that started in 2015 for higher-performing students hit their peak in 2019 and have since trended downward.
For a more comprehensive look at the data and the factors behind it, check out The 74’s full report.